Ktree offers a service to perform the Stress/Load testing on your Magento eCommerce
web application to ensure the load, scalability and performance of the web application.
1. Introduction
In this blog post, we will walk through on how to use Apache Jmeter to perform the load and stress testing on a eCommerce web application (Magento) environment. We will show you how to use the graphical user interface to build a test plan and to run tests against a web server to know the breakdown point.
Apache Jmeter can be used to simulate loads for various scenarios and output performance data in several ways, including CSV and XML files, and graphs.
2. Prerequisite
In order to perform the load testing, you will need to have a computer that you can run a load testing tool on, and a web server to load test against. Do not run these tests against your production servers unless you are confident that they can handle the load when the testing is in process, or you may negatively impact your server’s performance and the services integrated with your server.
Please note that the load test results can be skewed by a variety of factors, including the system resources (CPU and RAM) available and the network between load testing tool and the web server being tested. The size of the load that can generate without skewing the results can be increased by running the tests in the non-graphical mode or by distributing the load generation to multiple resources..
- Load testing tool : Apache Jmeter version 2.13 r1665067
- Packages required to run Jmeter : Oracle Java or OpenJDK (6 or later)
- Web application : Magento application on a web server
3. Building a Test Plan
Once the Jmeter is installed and ready to perform load testing, we need to build the test plans to execute. In this example we developed the test plans to
- Browse through the product catalog
- Visit one product description page
- Adding the product to cart
- Checkout and placing order
The above test plans are developed to execute both the scenarios as a registered customer (Where the authenticated login is required into the system) as well as a guest (without login into the web application).
These test plans are developed to accommodate to handle the dynamic values which the user provide as an input for below parameters,
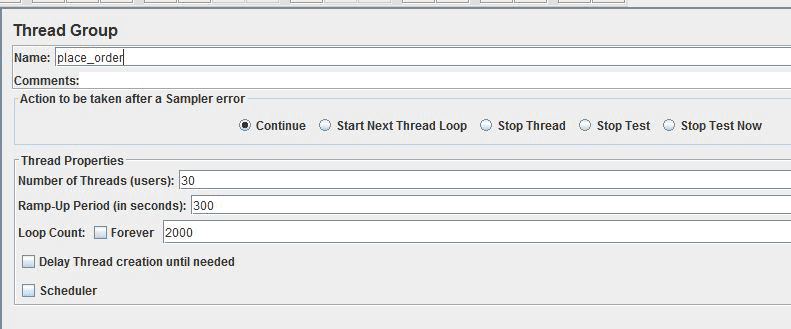
- Number of Threads (users): The number of users that JMeter will attempt to simulate. Here, it is set to 30
- Ramp-Up Period (in seconds): The duration of time that JMeter will distribute the start of the threads over. Set this to 300.
- Loop Count: The number of times to execute the test. Leave this set to 2000.
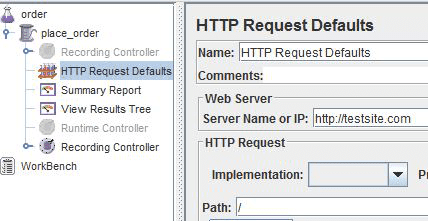
The HTTP Request Defaults Config Element is used to set default values for HTTP Requests in the test plan. This is particularly useful in sending the multiple HTTP requests to the same server as part of load testing. The Path ‘/’ indicates that all the sub pages can be accessed by the Jmeter based on the test plan.
Recording Controller allows JMeter to intercept and record your actions while you browse through web application with normal browser. JMeter will create test sample objects and store them directly into the test plan as you go.
The recorder is implemented as an HTTP(S) proxy server. We need to set up browser to use the proxy for all HTTP and HTTPS requests.
Add a summary report to the test plan by right clicking it. Go to Add > Listener > Summary report. Give the summary report a name and the location on the local system to save it. There is an option to record the summary report with only Errors or Successes and both. The expected report format can be selected by clicking the “Configure” button.
4. Run the Test Plan
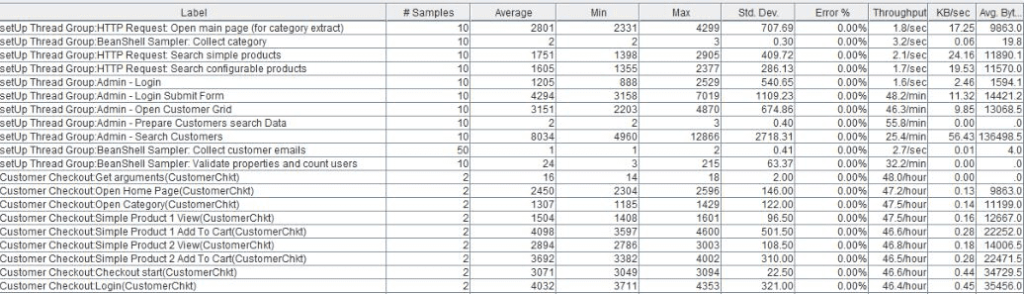
we are now ready to run the test plan which is set up , The results will start to generate once we start executing the test plan..
save the test plan by clicking on File then Save, specify the file name. The test plan always saves with an extension as “.jmx” . Select the option “View Results Tree” in the left pane, click “Run” from the main menu then click Start (or just click the green start arrow below the main menu). The test results will start to display in the result section as shown below when the test is run.
5. Increasing the Load
Once the test plan completes without any errors reported. We can now increase the load by increasing the Number of threads count(Users). In this example the load is now increased to 150 with the Ramp_period as 300 and 2000 Loops.
When the load is increased and the test is run, To check the performance of the web server login into it via SSH and see the CPU and Memory usage increasing.
6. Conclusion
As we keep on increasing the load, at some value for “No. of threads”, the View Result Tree will be displayed with an Error. Then it can be termed that as the system breakdown point.
In this example the system break down point limited to 135 for the test plan of placing an order. This states that when the number of users placing order simultaneously exceeds 135 then the system behavior will be adequate and turns out to transaction failures for the users.